Objective Distribution (distr_F)
import numpy as np
import math

from pyxla import load_data, distr_f
from pyxla.sampling import HilbertCurveSampler
sphere_sample = {
    "name": "Sphere",
    "X": HilbertCurveSampler(sample_size=100, dim=1, l_bound=-5, u_bound=5, seed=42),
    "F": lambda x: x**2,
    "V": [lambda x: x**2 - 2, lambda x: 8 * math.sin(20 * x)]
}

easom_sample = {
    "name": "Easom",
    "X": HilbertCurveSampler(sample_size=100, dim=2, l_bound=-5, u_bound=5, seed=42),
    "F": lambda X: np.cos(X[0]) * X[1] * np.e**(- (X[0] - np.pi)**2 - (X[1] - np.pi)**2)
}

load_data(sphere_sample) # loaded in-place
load_data(easom_sample) # loaded in-place
WARNING:root:The Hilbert curve with dimension 1 is just a number line. You are sampling around points on a number line.
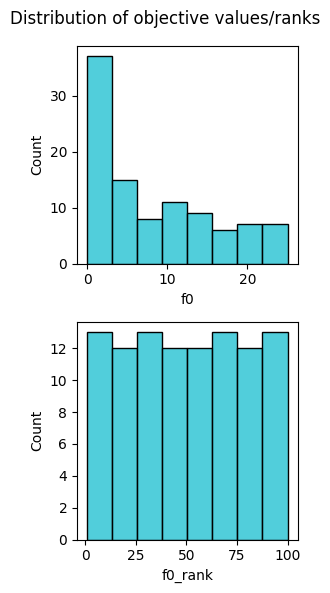
distr_f(sphere_sample)
({'f0_min': 0.001489075887394326,
  'f0_max': 25.0,
  'f0_mean': 8.306602377756104,
  'f0_med': 5.810982892827974,
  'f0_q1': 1.4835743521448939,
  'f0_q3': 13.953228429920058,
  'f0_sd': 7.631777799225109,
  'f0_skew': 0.6779687948562939,
  'f0_kurt': -0.79031951272523,
  'f0_rank_min': 1,
  'f0_rank_max': 100,
  'f0_rank_mean': 50.49,
  'f0_rank_med': 50.5,
  'f0_rank_q1': 25.25,
  'f0_rank_q3': 75.75,
  'f0_rank_sd': 29.028545686039195,
  'f0_rank_skew': -0.0019508370352342417,
  'f0_rank_kurt': -1.197706288002058},
 <Figure size 300x600 with 2 Axes>)
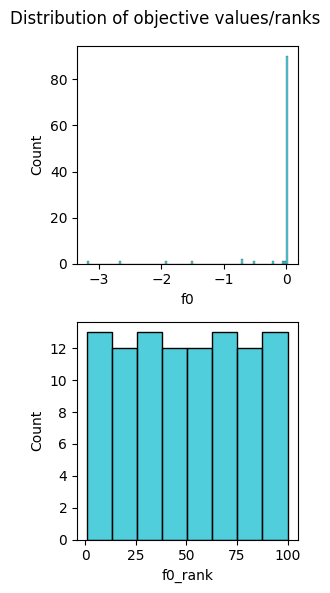
distr_f(easom_sample, bins=100)
({'f0_min': -3.188824393251793,
  'f0_max': 0.022187256000393916,
  'f0_mean': -0.11473730175309695,
  'f0_med': 1.414626424976435e-47,
  'f0_q1': -3.9515747245497193e-16,
  'f0_q3': 1.7113112570710332e-15,
  'f0_sd': 0.4845792776690805,
  'f0_skew': -4.8845955845649875,
  'f0_kurt': 24.200896623382185,
  'f0_rank_min': 1,
  'f0_rank_max': 100,
  'f0_rank_mean': 50.5,
  'f0_rank_med': 50.5,
  'f0_rank_q1': 25.25,
  'f0_rank_q3': 75.75,
  'f0_rank_sd': 29.011491975882016,
  'f0_rank_skew': 0.0,
  'f0_rank_kurt': -1.2002400240024003},
 <Figure size 300x600 with 2 Axes>)