Neighbouring Solutions’ Objective (Fitness) Values Correlation (NFC)
import numpy as np
import math

from pyxla import load_data, nfc
from pyxla.sampling import HilbertCurveSampler
sphere_sample = {
    "name": "Sphere",
    "X": HilbertCurveSampler(sample_size=100, dim=1, l_bound=-5, u_bound=5, seed=42),
    "F": lambda x: x**2,
    "V": [lambda x: x**2 - 2, lambda x: 8 * math.sin(20 * x)]
}

easom_sample = {
    "name": "Easom",
    "X": HilbertCurveSampler(sample_size=100, dim=2, l_bound=-5, u_bound=5, seed=42),
    "F": lambda X: np.cos(X[0]) * X[1] * np.e**(- (X[0] - np.pi)**2 - (X[1] - np.pi)**2)
}

load_data(sphere_sample) # loaded in-place
load_data(easom_sample) # loaded in-place
WARNING:root:The Hilbert curve with dimension 1 is just a number line. You are sampling around points on a number line.
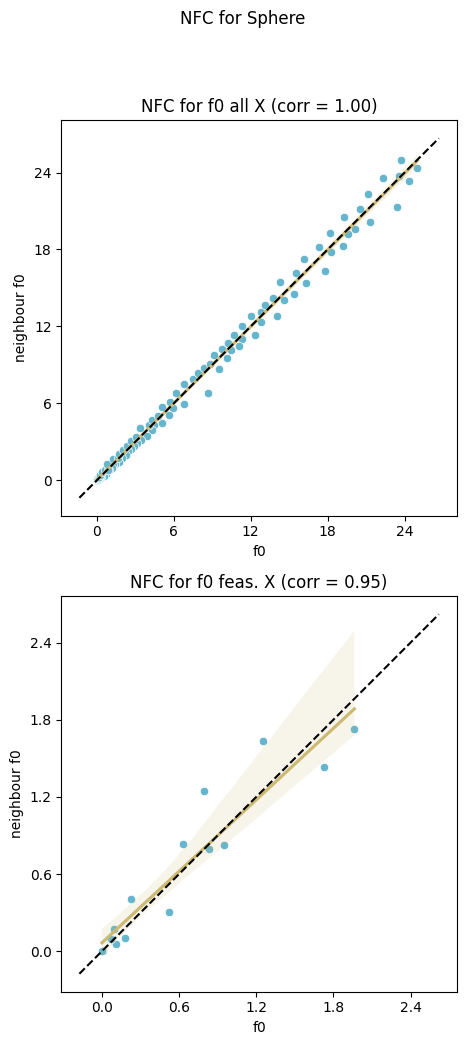
nfc(sphere_sample)
({'nfc_all_X_for_f0': np.float64(0.9969944341372912),
  'nfc_feas._X_for_f0': np.float64(0.9464285714285712)},
 <Figure size 500x1000 with 2 Axes>)
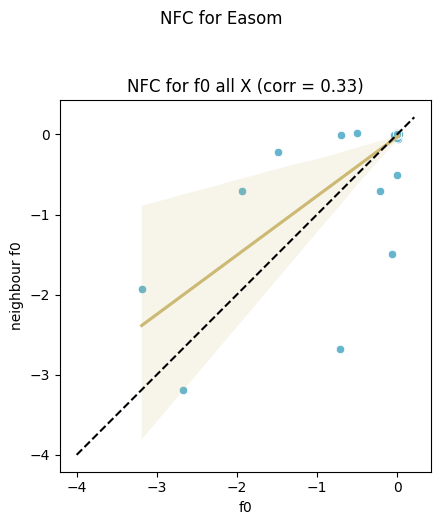
nfc(easom_sample)
({'nfc_all_X_for_f0': np.float64(0.33076066790352504)},
 <Figure size 500x500 with 1 Axes>)